
Record-high natural gas prices in Europe, fuel queues in the UK, electricity rationing in China.
A global energy crisis has emerged, affecting the lives of billions, part of a much larger story in 2021 about the fragility of supply chains.
This will take some time for the entire system to regain equilibrium — until that occurs, expect the impacts to continue to be felt far and wide.
How much longer will the energy crisis last?

This topic is a matter of concern, not just for consumers, but also for financial markets and central banks, who are trying to determine whether high energy prices will persist and potentially stunt economic growth.

Supply-related snafus will eventually get sorted out. The bigger and more important question concerns demand. Is there much of an appetite for energy in a world still influenced by the COVID-19 pandemic?
Coal and natural gas prices are at record highs in Europe and Asia; however, this surge has been driven by supply problems related to unfavorable weather conditions, among other causes.
Crude oil prices have also been rising, with the global benchmark recently touching a three year high. Overall, this market has been relatively calm, by comparison. We can, therefore, turn to fundamental data on the crude oil market for a better understanding of demand.
In this article, global crude oil inventories will be examined, leveraging Ursa Space’s satellite-derived measurements of storage tanks.
The three graphs below shed light on the
supply-demand balance in the oil market:
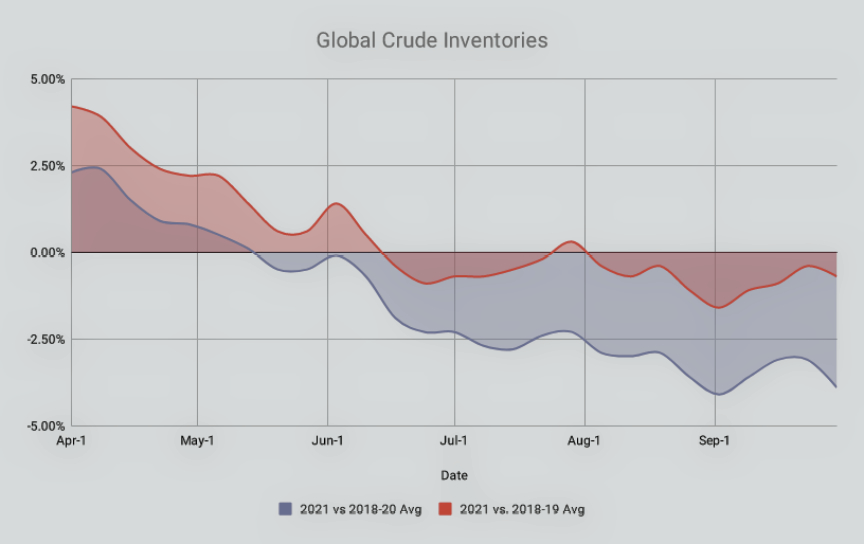
1. Global Crude Inventories
Where are global crude inventories in 2021 versus recent historical averages? Is the surplus that formed during 2020 gone?
The graph above plots global crude inventories from April 2021 to the end of September versus the average of the same time period in 2018-20 (blue) and 2018-19 (red).
This comparison shows where current levels stand versus recent historical averages. Crude oil inventories in 2020 were unusually high, so it’s also helpful to look at the data without 2020 for a better gauge of “normal.”
In April of 2021, crude inventories were still above recent historical levels, but that surplus evaporated by May/June, a significant turning point for the oil market.
Since then, inventories have remained below recent historical levels, although the deficit hasn’t grown. From this perspective, oil market fundamentals look fairly balanced, yet oil prices have surged.
The global oil benchmark has increased 50 percent this year, trading at its highest level since October 2018.
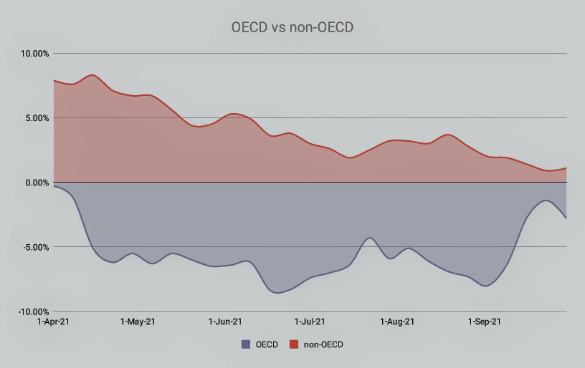
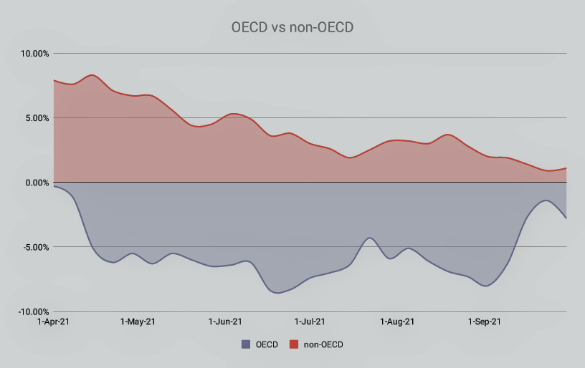
2. OECD vs Non-OECD
Is there any difference in crude inventory trends between Organization for Economic Co-operation and Development (OECD) members and countries outside the OECD?
The graph above right plots crude inventories from April 2021 to the end of September against the average of the same time period in 2018-19. The blue line represents only OECD members and the red line represents other countries.
In both cases, crude inventories have been falling, though there is a clear difference between the two.
By April of 2021, OECD inventories already wiped out the surplus vis-a-vis historical levels, and then fell deeper into a deficit. Countries outside the OECD hadn’t yet erased the surplus at this point in time, but a few months later, the surplus was nearly gone.
3. Cushing vs Dalian vs Rotterdam
What is the state of crude oil inventories at some of the world’s largest, most strategic storage locations?
A look at three major oil storage locations underscores the trends described above involving OECD vs. non-OECD inventories.
The chart directly above reveals the high points in 2021 for each location as a percentage of its 2018-19 average. Inventories were high for all three locations, more so at Dalian than Cushing or Rotterdam.
How have things changed since then? The right columns show September 2021 levels for each location as a percentage of its 2018-19 average. Cushing and Rotterdam swung into a deficit, similar to the broader OECD trend, while Dalian remained in a slight surplus, similar to the broader Non-OECD trend.
What does this say about crude oil market fundamentals?
Ursa Space data shows crude oil inventories returning to normal levels by spring 2021, and then settling into a balanced state.
Part of the reason is constrained supply, with OPEC and Russia continuing to withhold some supply from the market, but another likely factor has been a recovery in demand.


A balanced crude oil market should be a source of relief for the rest of the energy complex. This means that a sense of normalcy could return relatively soon.
Author Geoffrey Craig is a Global Market Analyst at Ursa Space Systems. Prior to joining Ursa, Geoff spent eight years at S&P Global Platts where he covered oil futures, renewables & emissions. He was also a Cairo-based business journalist for three years, during which time he traveled widely across the region. Geoff began his career as an International Trade Analyst at the US Department of Commerce. He holds a master’s degree from Columbia University School of International and Public Affairs.
Transporting Oil & Natural Gas
Advances in exploration and production have helped to locate and recover a supply of oil and natural gas from major reserves across the globe. At the same time, demand for petroleum- based products has grown in every corner of the world. But supply and demand are rarely concentrated in the same place. Transportation therefore is vital to ensuring the reliable and affordable flow of petroleum we all count on to fuel our cars, heat our homes and improve the quality of our lives.
Tankers, railroads and pipelines are proven, efficient and economical means of connecting petroleum supply and demand. Supply-end pipelines and railroads carry crude oil from production areas to a loading terminal at a port. Tankers then carry the crude oil directly to demand-side pipelines that connect to the refineries that convert the raw material into useful products. Oil Tankers
Today’s cutting-edge tankers are the product of a commitment to safety combined with the power of computer-assisted design. As a result, the new ships traveling the seas are stronger, more maneuverable, and more durable than their predecessors. Pipelines
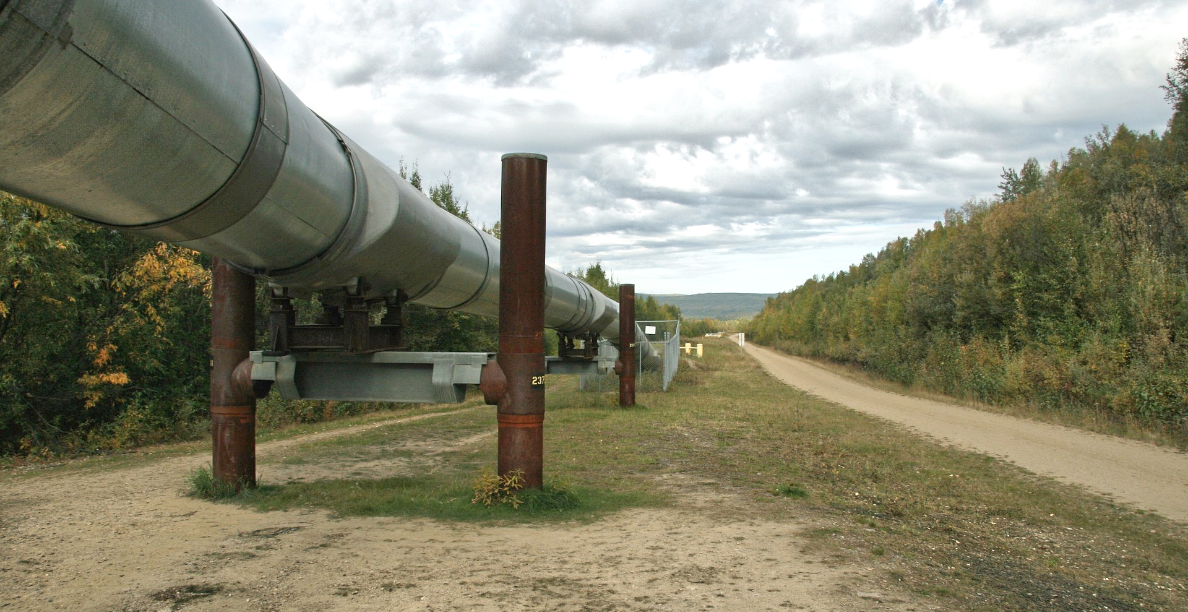
The nation’s more than 190,000 miles of liquid pipelines and over 300,000 miles of natural gas pipelines, which are the primary means of moving petroleum products to consumer markets. Pipelines are safe, efficient and, because most are buried, largely unseen. Pipeline Performance Tracking System
The Pipeline Performance Tracking System, PPTS, is a key component of the oil pipeline industry’s Environmental and Safety Initiative, a multi-discipline approach to understanding and improving industry performance. Rail Transportation
Railroad infrastructure supports the transportation needs of industries as diverse as oil and gas, manufacturing, and agriculture. North America benefits from an integrated railway system that is vital to reaching otherwise underserved markets. Railroads are a safe and efficient means of transporting crude oil and other petroleum products.